The question “What chart library to use in React?” came about when I had to actually find one to introduce in a project. As suggested by a colleague, I created this blog post with the results of my research, maybe saving others from having to do the same.

Charting Libraries


Many are built using the very versatile d3.js library:

If you already used Chart.js before, you may want to choose for the react-chartjs-2 wrapper:

Overview
| Library | Package size | Weekly downloads | Rendering type | Pricing | Documentation | Setup time demo |
|---|---|---|---|---|---|---|
| Recharts | 4.52 MB | 1,278,432 | Svg | MIT | Very good | 15:10 |
| Visx | 440 kB | 363,002 | Svg | MIT | Very good | 28:58 |
| Nivo | 2.81 MB | 296,292 | Svg / HTML / Canvas | MIT | Good | 28:31 |
| Victory | 2.95 MB | 192,203 | Svg | MIT | Very good | 11:10 |
| React-vis | 1.80 MB | 155,768 | Svg / Canvas | MIT | Ok | 34:39 |
| React-chartjs-2 | 4.88 MB | 948,010 | Canvas | MIT | Ok | 35:11 |
| Library | Dependency | Commits | Issues | Charts | Storybook | Docs |
|---|---|---|---|---|---|---|
| Recharts | D3 | 2 days ago (2,254) | 470 / 2220 | 11 | WIP | Examples |
| Visx | D3 | 1 month ago (3,156) | 117 / 608 | 20+ | CodeSandbox | Somewhat Interactive |
| Nivo | D3 | 4 days ago (1,992) | 81 / 1393 | 20 | YES | Very Interactive |
| Victory | D3 | last week (8,429) | 240 / 1491 | 10 | NO | Gallery |
| React-vis | D3 | 1 month ago (891) | 306 / 511 | 10 | Yes | Gallery |
| React-chartjs-2 | Chart.js | 4 months ago (544) | 52 / 665 | 15 | CodeSandbox | Gallery |
Columns:
Commits: Last commit (total commits)
Issues: Open Issues / Closed Issues
Charts: Since many libraries offer composable components, the real amount of charts is practically infinite. The amount is an indication of how many are documented! 😃
Data as of 19/04/2023.
Test Data Structure
[
  { name: "Bob", age: 11, },
  { name: "Tom", age: 13, },
  { name: "Bruno", age: 56, },
  { name: "Kyoe", age: 33, },
  { name: "Borat", age: 333, },
  { name: "Sasha", age: 68, },
  { name: "Onur", age: 27 }
]
Installation and Usage
How “easy” is to get a Line Chart working for each library?
Check out the Github source for working examples of these!
Recharts
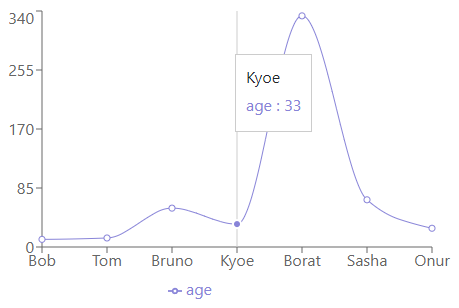
Time: 15 minutes.
A smooth experience. Lots of stuff out-of-the-box with little or no configuration (ex: tooltip and legend).
Example
Code
npm install --save recharts
import { useSelector } from "react-redux";
import { CartesianGrid, Legend, Line, LineChart, Tooltip, XAxis, YAxis } from "recharts";

export function Recharts() {
  const persons = useSelector(state => state.persons);

  return (
    <LineChart
      width={500}
      height={300}
      data={persons}
      margin={{ top: 5, right: 30, left: 20, bottom: 5 }}
    >
      <CartesianGrid strokeDasharray="3 3" />
      <XAxis dataKey="name" />
      <YAxis />
      <Tooltip />
      <Legend />
      <Line type="monotone" dataKey="age" stroke="#8884d8" />
    </LineChart>
  );
}
Visx
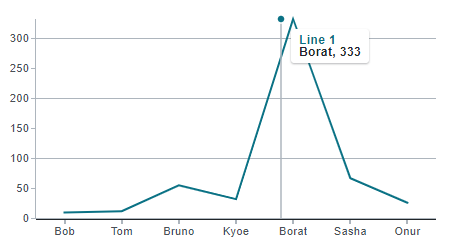
Time: 29 minutes
The x and y axis configuration was done in a bit of a roundabout way, but the main problem and what took the longest time to set correctly was the tooltip. For some reason the library makes the tooltip data object use properties that have no relevance to the data being inserted in the chart. It assumes all data inserted are datum objects whereas in this case they are person objects. The documentation also neglects to mention this in their example.
Example
Code
npm install --save @visx/xychart
import { Axis, Grid, LineSeries, Tooltip, XYChart } from "@visx/xychart";
import { useSelector } from "react-redux";

export function Visx() {
  const persons = useSelector(state => state.persons);

  const accessors = {
    xAccessor: (d ?: IPerson) => d && d.name,
    yAccessor: (d ?: IPerson) => d && d.age,
  };

  return (
    <XYChart
      width={500}
      height={300}
      xScale={{ type: "band" }}
      yScale={{ type: "linear" }}
    >
      <Axis orientation="bottom" />
      <Axis orientation="left" />
      <Grid columns={false} numTicks={4} />
      <LineSeries dataKey="Line 1" data={persons} {...accessors} />
      <Tooltip
        snapTooltipToDatumX
        snapTooltipToDatumY
        showVerticalCrosshair
        showSeriesGlyphs
        renderTooltip={({ tooltipData, colorScale }) => (
          <div>
            <div style={{ color: colorScale?.(tooltipData?.nearestDatum?.key!) }}>
              {tooltipData?.nearestDatum?.key}
            </div>
            {accessors.xAccessor(tooltipData?.nearestDatum?.datum)}
            {", "}
            {accessors.yAccessor(tooltipData?.nearestDatum?.datum)}
          </div>
        )}
      />
    </XYChart>
  )
}
Nivo
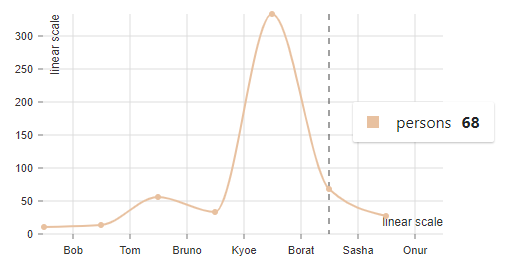
Time: 29 minutes
My main gripe and time sink with this package was the issue that the data properties needed to be called x and y respectively, so I needed to map my dataset to fit this mold. A simple setting for setting what properties you want to use on which axis would have been nice. Big visual issue however as you can probably tell is that the values don’t exactly show correctly on the x axis.
Example
Code
npm install --save @nivo/core @nivo/line
import { Line } from "@nivo/line";
import { useSelector } from "react-redux";

export function Nivo() {
  const persons = useSelector(state => state.persons);
  const data = persons.map(p => ({ x: p.name, y: p.age }));

  return (
    <Line
      width={500}
      height={300}
      curve="monotoneX"
      margin={{ top: 20, right: 20, bottom: 60, left: 80 }}
      enableSlices="x"
      data={[{ id: "persons", data: data }]}
      xScale={{ type: "band" }}
      yScale={{ type: "linear" }}
      axisLeft={{ legend: "linear scale", legendOffset: 12 }}
      axisBottom={{ legend: "linear scale", legendOffset: -12 }}
    />
  );
}
Victory
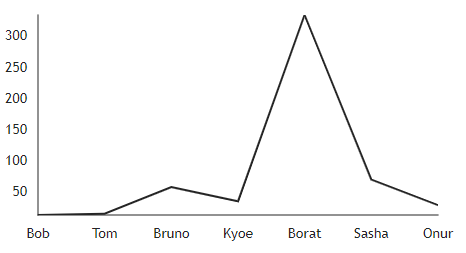
Time: 11 minutes
Usage was relatively easy, but it has the same limitation as the Nivo library because you also need to map your data properties to x and y. Also visually it doesn’t look as pleasing as some of the other charts in this list.
Example
Code
npm install --save victory
import { useSelector } from "react-redux";
import { VictoryChart, VictoryContainer, VictoryLine } from "victory";

export function Victory() {
  const persons = useSelector(state => state.persons);
  const data = persons.map(p => ({ x: p.name, y: p.age }));

  return (
    <>
      <VictoryChart
        height={300}
        width={500}
        containerComponent={<VictoryContainer responsive={false} />}
      >
        <VictoryLine data={data} />
      </VictoryChart>
    </>
  );
}
React-vis
Time: 35 minutes
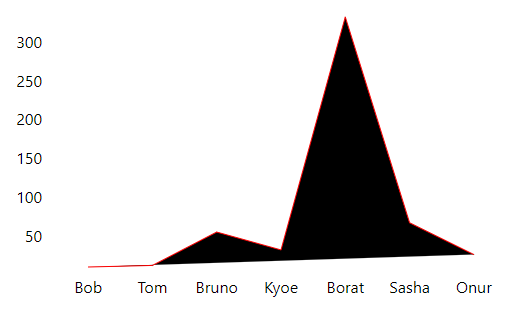
I could not get this chart to render remotely well. The documentation did not really help either in this case. Also I needed to map the data properties to x and y as well again.
Example
Code
npm install --save react-vis
import { useSelector } from "react-redux";
import { XYPlot, XAxis, YAxis, HorizontalGridLines, LineSeries } from "react-vis";

export function ReactVis() {
  const persons = useSelector(state => state.persons);
  const data = persons.map(p => ({ x: p.name, y: p.age }));

  return (
    <XYPlot width={500} height={300} xType="ordinal">
      <HorizontalGridLines />
      <XAxis />
      <YAxis />
      <LineSeries color='red' data={data} />
    </XYPlot>
  );
}
React-chartjs-2
Time: 35 minutes
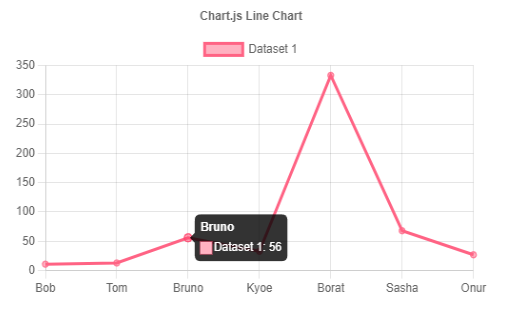
Documentation for this library was kind of limited, especially when it came to creating a line chart. An annoying trait is that you have to split your dataset up in into a labels array for the x axis and data array for the y axis. The end result does look nice however.
Example
Code
npm install --save react-chartjs-2 chart.js
import { useSelector } from "react-redux";
import { Chart as ChartJS, CategoryScale, LinearScale, PointElement, LineElement, Title, Tooltip, Legend } from "chart.js";
import { Line } from "react-chartjs-2";

ChartJS.register(CategoryScale, LinearScale, PointElement, LineElement, Title, Tooltip, Legend);

const options = {
  responsive: false,
  plugins: {
    legend: {
      position: "top" as const,
    },
    title: {
      display: true,
      text: "Chart.js Line Chart",
    },
  },
};

export function ReactChartJS2() {
  const persons = useSelector(state => state.persons);
  const labels: string[] = persons.map(person => person.name);
  const ages: number[] = persons.map(person => person.age);
  const data = {
    labels,
    datasets: [{
      label: "Dataset 1",
      data: ages,
      borderColor: "rgb(255, 99, 132)",
      backgroundColor: "rgba(255, 99, 132, 0.5)",
    }],
  };

  return (
    <Line width={500} height={300} options={options} data={data} />
  );
}
Conclusion
Onur: Recharts
First time was a charm, the first library Recharts did everything I wanted it to in a clear and convenient manner. It’s the only library where I didn’t really have a complaint. It’s easy to use and has very good documentation.
Wouter: Nivo
Disclaimer: I didn’t actually implement the Line Charts.
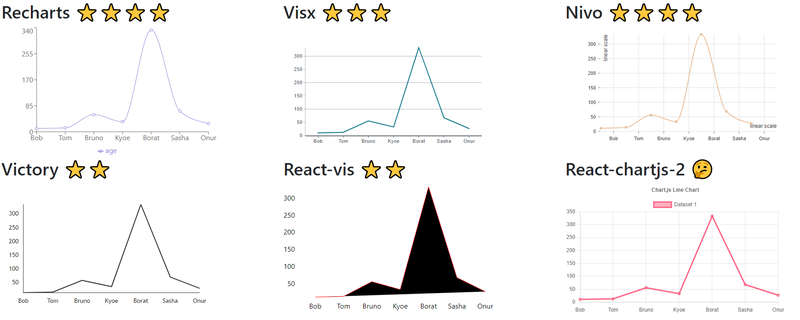
The out of the box experience of the Line Chart was, for me, really nice for Recharts, Nivo and React-ChartJS-2.
I was really impressed with the documentation of Nivo: a very interactive gallery plus a storybook implementation, just wow. The dev team also seems to be on top of things with 81 open issues and a whopping 1393 closed ones. It’s the only library with a below v1 version though and has not yet gained as much traction (300k weekly downloads) compared to current leaders Recharts (1.5M) and React-chartjs-2 (950k), the latter which coasts of the popularity of Chart.js itself.
Deployed Demo App
The create-react-app is published at itenium-be.github.io.
Extras
Stuff that came into being during the making of this post
Package Versions


