Breakpoints
Control + Alt + E: Control on which exceptions to break with the Exceptions window
Control + Alt + B: Breakpoints window
F9: Toggle breakpoint
Control + F9: Enable/Disable breakpoint
Control + Shift + F9: Delete all breakpoints
Control + B: New function breakpoint dialog
Useful when you want to add a breakpoint to every method with a specific name.
Alt + F9, C: Breakpoint condition
Alt + F9, L: Breakpoint label
Assigning labels to breakpoints could be handy together with the export/import functionality?
Breakpoints in DEBUG mode only:
using System.Diagnostics;
Debug.Fail();
Debug.Assert(true, "Conditional break");
Attributes
When you need to do some calculations for your assertions put it in a method decorated with the ConditionalAttribute("DEBUG").
Inspection
Hover over a variable to see its value. Double click on it to change its value. Override ToString() or use the DebuggerDisplayAttribute() to display something better than GetType().FullName for your own classes.
Attributes:
[DebuggerDisplay("Count={count}")]
class Counter
{
    [DebuggerBrowsable(DebuggerBrowsableState.Never)]
    public int count = 4;

    [DebuggerBrowsable(DebuggerBrowsableState.RootHidden)]
    public int[] y => new[] {1, 2, 3};
}
More control with DebuggerTypeProxy:
Use this attribute when you need to significantly and fundamentally change the debugging view of a type, but not change the type itself.
Windows
Shift + F9: QuickWatch window for variable on cursor (blocking)
Control + Alt + C: Call stack window
Control + Alt + W, 1-4: Watch windows 1-4
Control + Alt + A: Command window
Locals and Autos
Open from menu:
- Debug > Windows > Locals
- Debug > Windows > Autos
Can see member return values in the Autos window.
Text in red: variable value changed since last evaluation.
Output Window
Menu: Debug > Windows > Output
Control what is written to the Output Window with Tools > Options > Debugging > Output Window
Debug.Write("msg");
Debug.WriteIf(true, "msg");
Debug.WriteLine("msg");
Debug.WriteLineIf(false, "msg");
Control + Alt + I: Immediate window
Can access local variables and call methods. Even Linq queries are possible here.
Visualizers
One of my favourite bloggers, Phil Haack created the Visual Studio visualizer Encourage.
 haacked/encourage: A bit of encouragment added to Visual Studio
Plugins
ReadableExpressions (download)
 agileobjects/ReadableExpressions: Readable views of Expression Trees
DataTable Visualizer (download)
 MgSam/DataTableVisualizer: A non-modal, dockable, searchable DataTable visualizer
Image Visualizer (download)
 aberus/ImageVisualizer
Entity Visualizer (download)
 kpol/EntityVisualizer: Display SQL source code generated by Entity Framework
LINQBridgeVs (download)
 codingadventures/LINQBridgeVs: Bridge between a Visual Studio debugging session and LINQPad.
Not open source:
New in Visual Studio
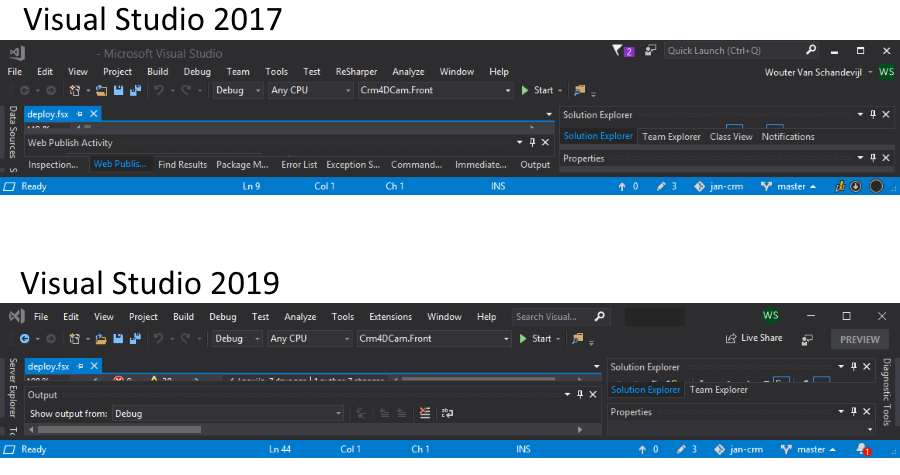
Visual Studio 2017
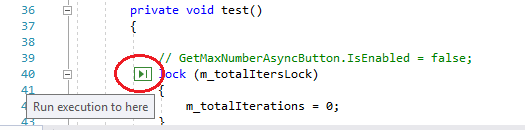
Run to click:
Visual Studio 2019
- Promises “significant” performance improvements in stepping
- Yipiee, they added search to Autos, Locals and Watch windows! (Options > Debugging > Search)
- They also managed to cut 25px from the title bar and still make it look pretty slick.
