React Component Profiling
posted in javascript on • by Van Schandevijl WouterSerious rendering performance troubles in confac, our internal React invoicing app. It reads the entire database in memory 😲 and works pretty much exclusively on the frontend with the Redux store, so it’s not the db that is the performance bottleneck for once 😜
Worst case scenario on the /monthly-invoicing page is a whopping 10s wait time for
a single screen to become responsive. Not good.
React Developer Tools
The React Developer Tools Chrome extension adds two tabs to DevTools:
- ⚛️ Components: like Inspect Element but with React tags
- ⚛️ Profiler: the simple and excellent React Component Profiler
Profiler Tab
Action Buttons
- / : Start / Stop profiling
- : Reload page and start profiling
- : Clear profiling data
- / : Select previous / next commit
Display
- : Flamegraph chart
- : Ranked chart
Interesting Settings
Filter the output once it becomes unwieldly in the settings modal:
Components > Hide components where...: custom result filtering based on DOM type (ex: div), name, …Profiler > Hide commits below x ms: ignore very fast renders (ex: rerenders for tooltips)
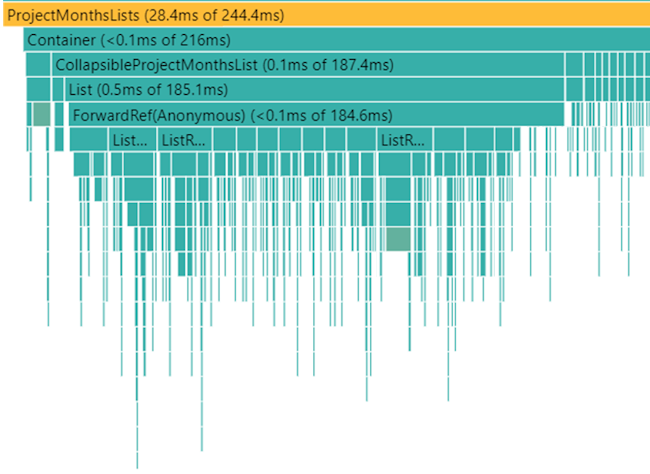
Using the Profiler
Press the “ Start profiling” button, perform the action(s) that take too long and press the “ Stop profiling” button. Or use “ : Reload page and start profiling” when it’s your initial page load that is taking too long.
The default “ : Flamegraph chart” display is perfect as long as the next performance issues are easy to pick out.
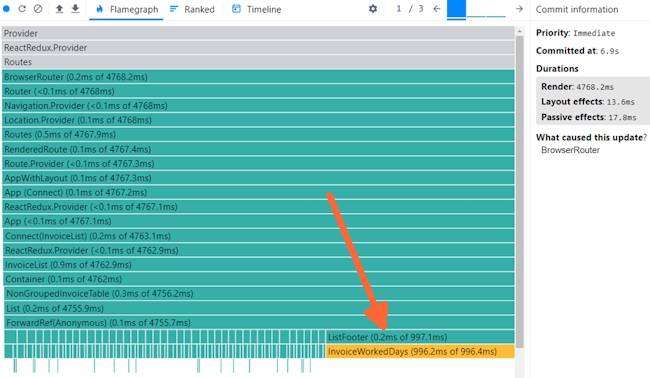
Easy Pickings
⏱️ 6 seconds for 100 invoices/rows.
The first three profiling rounds revealed that the biggest issues were in non-component code:
- Third Party Packages: Do not assume that free, open-source, packages will be performant.
- Nested Loops: Several inner loops caused a significant CPU-bound delay.
- Frequent I/O:
sessionStoragewas being accessed for each component wrapped in a role check.
Culprit 1: Third Party Package
InvoiceWorkedDays, the component in confac that was causing all this fuzz:
The part that was eating up all this time was date-holidays,
an npm package used to calculate the official Belgian holidays.
The date-holidays can calculate holidays for Chinese, Korean and every other calendar out in existence.
Because of the un-tree-shakable initialization const hd = new Holidays('BE'); all the code for those
calendars were also being parsed.
Sub-dependencies included astronomia,
leading to a footprint of about 10MB.
We have since replaced the dependency with our own, dedicated (76 liner), npm package
@itenium/date-holidays-be.
Culprit 2: Nested Loops (CPU)
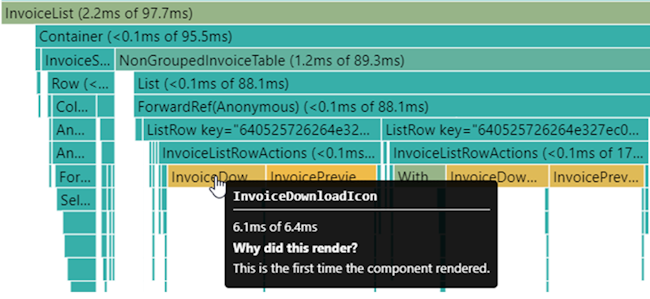
// InvoiceDownloadIcon
const fullProjectMonth = useProjectMonthFromInvoice(invoice._id);
This custom Hook would first make a FullProjectMonth of all ‘projectMonth’ records
in the Redux store and then pick the one with invoice._id.
Problem here was, that to resolve a “projectMonth”, 5 other collections needed to be traversed as well. As the data grew, time spent here grew considerably.
// fn mapToProjectMonth
const project = confacState.projects.find(p => p._id === projectMonth.projectId);
const consultant = confacState.consultants.find(c => c._id === project.consultantId);
const client = confacState.clients.find(c => c._id === project.client.clientId);
const partner = confacState.clients.find(c => project.partner && c._id === project.partner.clientId);
const invoice = confacState.invoices.find(i => i.projectMonth && i.projectMonth.projectMonthId === projectMonth._id);
We can greatly optimize this by first filtering on invoice._id so the 5 inner loops are executed just once!
Culprit 3: I/O (sessionStorage)
⏱️ 2 seconds for 100 invoices/rows.
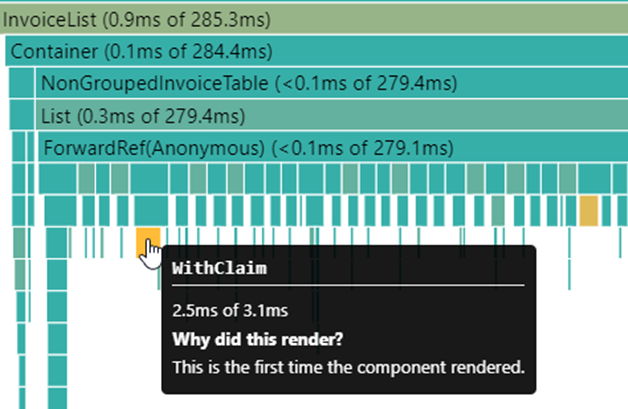
It’s starting to become difficult to discern the next performance culprit. The second profiler display method “ : Ranked chart” to the rescue!
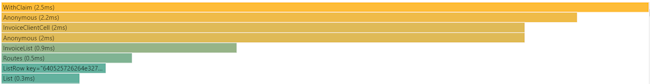
The Code
// The decorator
export const EnhanceWithClaim = <P extends object>(Component: React.ComponentType<P>) =>
  class WithClaim extends React.Component<P & EnhanceWithClaimProps> {
    render() {
      const {claim, ...props} = this.props;
      if (claim) {
        const claims: string[] = authService.getClaims();
        if (!claims.includes(claim)) {
          return null;
        }
      }
      return <Component {...props as P} />;
    }
  };

// Wrap a component
const LinkWithClaim = EnhanceWithClaim(Link);

// Usage
const CreateInvoiceLink = () => (
  <LinkWithClaim claim="invoice-create" to="/invoices/create">
    Create Invoice
  </LinkWithClaim>
)
The culprit here turned out to be authService.getClaims(),
which ended up doing the following for every of the hundreds
of icons, buttons etc displayed.
// I/O being executed many, many times == performance impact!
const token = sessionStorage.getItem('jwt');
Alternatives
When you are rendering a grid with thousands of rows, you’ll always going to end up with a performance problem (at some point).
There are several mitigations:
- Pagination Implemented!
- Partial data load (only load last year worth of data in memory at startup) Implemented!
- Debouncing: Useful when filtering the grids, only start a rerender when the user is done entering the filter criteria
- Virtualization & Infinite Scroll: A grid can display an “infinite” amount of rows and still be performant!
- Suspense & useDeferredValue: Not relevant here because all data is already in memory
Conclusions
⏱️ 360 ms for 100 invoices/rows.
These were the “easy pickings”, where the profiler’s flamegraph gave it to us straight. This greatly improved performance (6s -> 360ms) which is good enough.
- Not doing a calculation or render is the best optimalization
- Keep an eye on 3rd party packages
- I/O operations are expensive
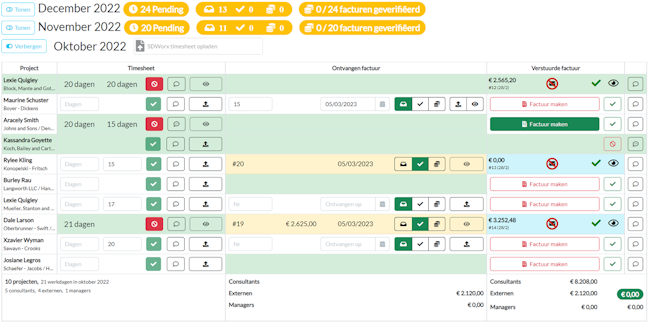
The Meaty Part
There is another screen and performace there is… disastrous.
- Everything is re-rendered whenever a projectMonth gets collapsed/opened.
- Opening more and more projectMonths gets slower and slower.
- ⏱️ 2 open projectMonths: 350ms
- ⏱️ 4 open projectMonths: 1.2s
- ⏱️ 18 open projectMonths: 5s
- Filters are remembered between route changes.
- Navigating back can be painfully slow when many projectMonths were open.
- ⏱️ With 18 open projectMonths: 4.4s
Belgian Holidays Cache
For this workshop, date-holidays was not replaced with a more dedicated and efficient alternative.
Instead we’re using it as a placeholder for something that would actually take a long time
and cannot be so easily improved.
To get to the following flamegraph, we added a simple cache for the date-holidays dependency.
const workDaysInMonthCache: {[month: string]: number} = {};
Avoiding IFeature Construction
The IFeature configures a grid and CRUD pages for a backend entity.
It contains the data and currently active filters. The problem here
is that the openMonths: string[] filter is also part of the data
of the IFeature.
Because of how Redux works, the openMonths: string[] filter becomes a new
array reference each time a projectMonth is opened/collapsed. This causes
all months to be re-rendered instead of just the one being toggled
because the filters object has changed.
Furthermore, the expensive IFeature construction is not necessary
when the projectMonth is collaped. Instead we can map directly to
CollapsedProjectMonthBadgeTotals, which doesn’t include any inner loops.
export const ProjectMonthsList = ({feature, month}: ProjectMonthsListProps) => {
  // If this isn't a Demeter violation, I don't know what is 😓
  if (feature.list.filter.state.openMonths.includes(month)) {
    return (
      <>
        <Toolbar feature={feature} />
        <List feature={feature} />
      </>
    );
  }

  // When the ProjectMonth is collapsed, we don't
  // really need to construct the IFeature...
  return <ProjectMonthListCollapsed feature={feature} />;
};
Introducing: Reselect
A library for creating memoized “selector” functions. Commonly used with Redux and comes with the @reduxjs/toolkit.
Caching the expensive mapping to FullProjectMonthModels & CollapsedProjectMonthBadgeTotals
with createSelector:
// Create the selector
import { createSelector } from 'reselect';

export const createFullProjectMonthsSelector = () => createSelector(
  // Select required store data
  // Rerenders happen when these references change
  (state: ConfacState) => state.projectsMonth,
  (state: ConfacState) => state.projects,
  (state: ConfacState) => state.consultants,

  // Introduce a "month" parameter for the selector
  (_, month: string) => month,

  // The actual mapping
  (projectsMonth, projects, consultants, month) => {
    const context = { projectsMonth, projects, consultants }
    return projectsMonth
      .filter(x => isSameMonth(x.month, month))
      .map(x => mapToProjectMonth(context, x));
  },

  // Optional configuration
  {
    memoizeOptions: {
      equalityCheck: (a, b) => a === b, // ex: use deep-equal instead
      maxSize: 10, // selector cache
      // import { shallowEqual } from 'react-redux';
      resultEqualityCheck: shallowEqual
    }
  }
);
Introducing: useMemo
Skip expensive recalculations with useMemo
useMemo(calculateValue, dependencies)
We now need to cache the createFullProjectMonthsSelector mapped data
for each month. Because we want to keep a memoized version of each month,
we pass an empty array as the dependencies argument to useMemo.
If you need to cache only until the month changes, as in when you are
navigating from one detail page to another, the dependencies would become
[month].
// Selector usage
import { useMemo } from 'react';

export const OpenedProjectMonthsList = ({ month }: OpenedProjectMonthsListProps) => {
  // Use the createSelector as defined above
  // With empty array as dependencies argument
  const selectProjectMonths = useMemo(createFullProjectMonthsSelector, []);

  // Use the memoized selector
  const projectMonths = useSelector(state => selectProjectMonths(state, month));

  // And construct the IFeature
  return <List feature={projectMonthFeature(projectMonths)} />;
};
Introducing: memo
When a ProjectMonthListCollapsed is rendered, its details don’t change,
so we can do some aggressive caching there, keeping the entire rendered
component in the cache with React.memo(component, propsAreEqual?).
import { memo } from 'react';

// Memoize the component for each value of month
const ProjectMonthListCollapsedMemo = memo(({ month }) => {
  return <ProjectMonthListCollapsed month={month} />;
});


export const OpenOrClosedProjectMonthsList = ({ month }) => {
  const isOpen = useSelector(state => state.filters.projectMonths.openMonths[month]);
  if (isOpen) {
    return <OpenedProjectMonthsList month={month} />;
  }
  return <ProjectMonthListCollapsedMemo month={month} />;
};
The Aftermath
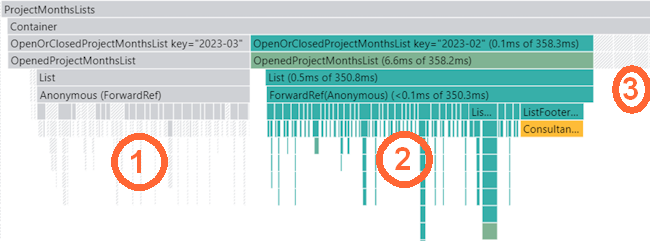
- No re-render of the previously opened projectMonth (reselect & useMemo)
- The render of the newly opened projectMonth
- The completely cached collapsed/closed projectMonths (memo)
Conclusions
- ⏱️ 2 projectMonths: 350ms -> 170ms
- ⏱️ 4 projectMonths: 1.2s -> 311ms
- ⏱️ 18 open projectMonths: 5s -> 140ms
The biggest win was avoiding the re-renders of all projectMonths when opening/closing just one and caching expensive Redux selects.
Take-Aways
- Depend on as little as possible
- Components should rely on their minimum requirements of state and props only
- Prefer props only for low level components
- Cache expensive calculations
- createSelector, useMemo and memo are your friends
The IFeature
“Weeks of coding can save you hours of planning.” — Fred Brooks
Unexpected Side-Effect
The overal structure and code quality has improved due the refactorings needed to realize the performance targets.
- More components with finer grained purpose resulted in a clearer component hierarchy
- Complexity has increased but it is hidden away in hooks and selectors
Profiler Alternatives
If the Chrome Profiler Extension isn’t cutting it for you anymore, you can still fallback to these alternatives for locating performance optimalization targets.
console.time
Good old console 😉
console.time('timer1')

const result = expensiveOp1()
console.timeLog('timer1', 'result is', result)
expensiveOp2()

console.timeEnd('timer1')
Profiler Component
<Profiler /> doesn’t actually render anything
and can be nested by providing different ids.
import { Profiler } from 'react';

function callback(
  id, // the "id" prop of the Profiler tree that has just committed
  phase, // either "mount" (if the tree just mounted) or "update" (if it re-rendered)
  actualDuration, // time spent rendering the committed update
  baseDuration, // estimated time to render the entire subtree without memoization
  startTime, // when React began rendering this update
  commitTime, // when React committed this update
  interactions // the Set of interactions belonging to this update
) {
  console.log(`${id}: ${phase} in ${actualDuration}`);
}

const LongRendering = () => (
  <Profiler id="uniqueId" onRender={callback}>
    <LongRenderingItem />
  </Profiler>
)
For a simple case like this with only one <Profiler, you are better off just using
the Chrome extension.
It can come in handy for micro optimizations, using multiple <Profiler />s
and hundreds/thousands of components. At that point you will need to write your
own aggregator in the callback to make some sense of the data.
A simple aggregator on ID:
type ITiming = {
  renders: number;
  totalTime: number;
  averageTime?: number;
}

const timings: {[key: string]: ITiming} = {}

function callback(id, phase, actualDuration) {
  if (!timings[id]) {
    timings[id] = {renders: 1, totalTime: actualDuration};
  } else {
    const oldTimings = timings[id];
    timings[id] = {
      renders: oldTimings.renders + 1,
      totalTime: oldTimings.totalTime + actualDuration
    };
  }

  timings[id].averageTime = timings[id].totalTime / timings[id].renders;
}
Further Optimalizations
- Avoid inline styles
- useCallback: cache event handlers
- Tricky: useCallback also takes time; in my case it actually degraded performance
- As always with perf optimizations –> MEASURE (the profiler is your friend)
- memo: Components without props can be cached entirely
- useWhyDidYouUpdate: part of many hooks-libraries (I didn’t find it very usefull)
- useDebugValue: to be used in custom hooks (more for library developers IMO)
-
 amsterdamharu/selectors
:
Examples of reselect selectors
amsterdamharu/selectors
:
Examples of reselect selectors